An answer:
An answer:
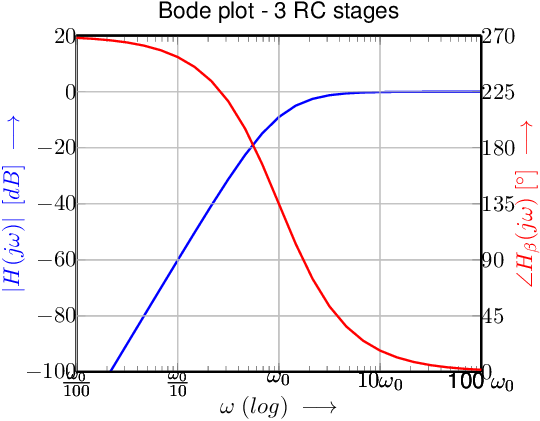
For the Bode plot, we defined .
An answer:
Using symmetry is the easiest and leads to:
An answer:
A = -8
An answer:
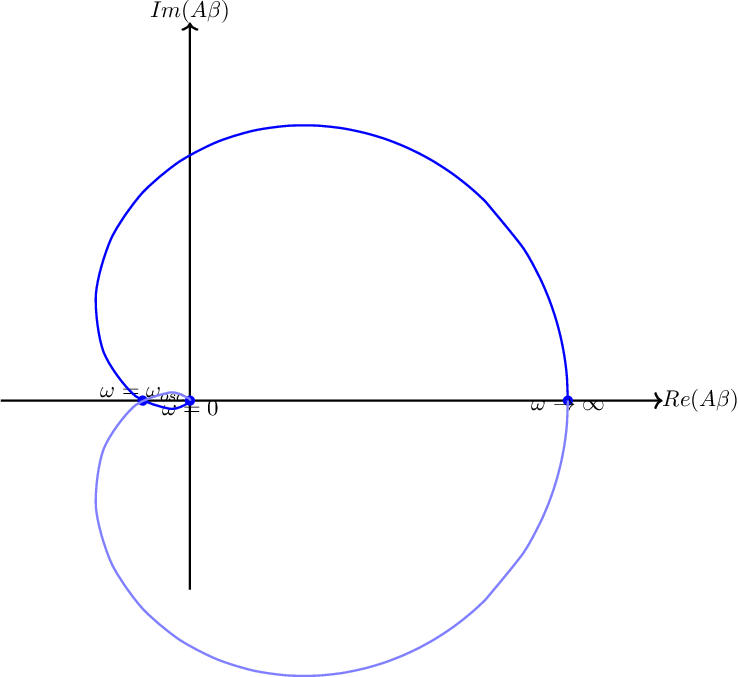
The polar plot of
is shown in blue for positive ;
the light blue curve is for negative frequencies and is required to make it a Nyquist plot.